
Market Review – July 2026
Key Themes:
-
Australian shares held up while global technology stocks were sold down: Australian shares finished ahead of most overseas markets, helped by a strong month for energy and bank shares. Overseas, doubt crept into the AI trade, which caused share markets in the US, Japan, South Korea, and Taiwan to fall sharply before recovering late in the month.
-
Bonds fell as the higher oil price revived inflation worries: Longer-term interest rates rose around the world as investors worried that higher energy prices would keep inflation high and force central banks to raise rates again.
-
The Australian dollar rose: Higher oil and commodity prices, better economic data out of China, and stubborn inflation at home lifted the Australian dollar.
-
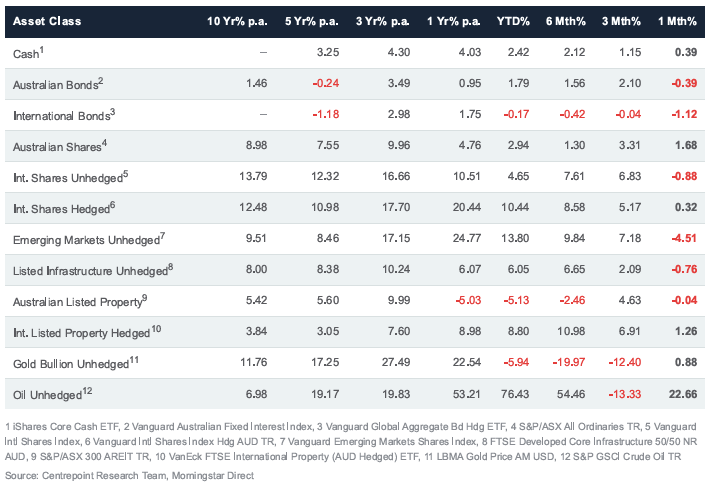
The oil price surged again as fighting in the Middle East resumed: Hostilities between the United States and Iran restarted in early July, tankers came under attack in the Strait of Hormuz, and oil rose 22.66% over the month. This reversed most of the fall recorded in June.
How the different asset classes have fared
(As at 31st July)
International Equities
International shares fell 0.88% on an unhedged basis and rose 0.32% on a hedged basis. The Australian dollar rose against the US dollar over July, and when the Australian dollar rises, overseas investments are worth less once they are converted back into Australian dollars. Investors who had removed the currency effect through hedging therefore saw a slightly better result, and one that is closer to how the underlying share markets actually performed.
Beneath those modest headline numbers, July was a volatile month. Technology and semiconductor shares were sold down heavily in the middle of the month as investors questioned whether the enormous amounts being spent on AI infrastructure would earn an acceptable return. The falls were deepest in Asia, where Japanese and South Korean technology names dropped very sharply, and the US Nasdaq index also fell over the month. Europe slightly offset this, with the regional STOXX 600 index posting a monthly gain of 1.55% and trading close to a record high, supported by strong company profit results and by energy and defence shares. A recovery in the final days of the month repaired some of the earlier damage.
Emerging markets were the weakest part of the table, falling 4.51%. This reflected the same story, because South Korea and Taiwan are home to many of the world’s most important semiconductor and AI hardware manufacturers and dominate the emerging markets index. Having led the index higher for much of the past year, those markets gave back a large amount of ground in July as Taiwan’s TAIEX index fell 8.29% and South Korea’s KOSPI fell 20.57%.
Australian Equities
Australian shares rose 1.68%, a fourth consecutive monthly gain and a better result than most overseas markets. The Australian share market has very few large technology or semiconductor companies, so it was largely insulated from the selling that hit the sector globally.
The gains were concentrated in a few areas. Energy was easily the strongest sector, lifted by the rebound in the oil price and by wider refining margins. Financials, and the major banks in particular, also performed well as CPI came in below expectations, and Healthcare continued the recovery it began in June. Smaller companies did not share in the gains, with the small company index falling by 2.80% over the month as investors favoured larger, more defensive names. Sentiment improved late in July after inflation figures came in slightly softer than expected, which reduced the chance of another interest rate rise.
Australian listed property was flat, returning -0.04%, and remains the weakest asset class in the table over the past year at -5.03%. Higher longer-term interest rates continue to weigh on property values, because property is valued partly by comparison with the return available on bonds.
Domestic and International Fixed Income
Australian bonds returned -0.39% in July. The Reserve Bank of Australia (RBA) did not meet during the month, so the cash rate remained at 4.35%. The main influence was the rise in longer-term interest rates, with the yield on the 10-year Australian government bond rising about 0.23 percentage points over July to around 4.94%. Bond prices move in the opposite direction to yields, so this rise produced a small negative return that partly offset the income the bonds paid. The June quarter inflation figures released on 29 July were a little softer than expected, with the RBA’s preferred trimmed mean inflation running at 3.60% over the year. That is still above the RBA’s 2–3% target band, but it was enough for investors to scale back their expectations of another rate rise.
International bonds returned -1.12% over the month. The US Federal Reserve left its interest rate unchanged on 29 July, but three of its officials voted against that decision because they wanted rates raised. With the oil price surging at the same time, investors concluded that inflation would be harder to bring down than they had previously assumed. Longer-term US interest rates rose as a result, with the 30-year government bond yield reaching its highest level since 2007 and the 10-year yield ending the month near 4.70%. Higher yields mean lower bond prices, which is what produced the negative return.
Australian Dollar
The Australian dollar rose against the US dollar over July, moving from around US$0.69 at the start of the month to about US$0.70 at month-end, a gain of roughly 1.87%.
Three forces were behind the move. The sharp rise in the oil price and firmer commodity prices generally improved Australia’s export earnings, which tends to support the currency. Better-than-expected industrial data out of China, Australia’s largest export market, added to that support. Finally, inflation in Australia remained high enough that investors could not rule out a further RBA rate rise, while the US dollar weakened late in the month after the US Federal Reserve left rates on hold and gave markets little guidance about its next move. Higher relative interest rates tend to attract money into a currency.
Commodities – Gold and Oil
Oil was the standout mover of the month, rising 22.66% and reversing most of the 18.47% fall recorded in June.
Fighting between the United States and Iran resumed in early July, tankers transiting the Strait of Hormuz were attacked, and further attacks on shipping in the Red Sea added to the disruption. Brent crude, the main international benchmark, climbed from close to its pre-conflict level at the start of July to briefly trade above US$100 a barrel late in the month, before settling around US$90 a barrel at month-end. The Strait of Hormuz carries a large share of the world’s seaborne oil, so any threat to it moves the price quickly.
Gold returned 0.88%. Because this is an unhedged return and the Australian dollar rose over the month, the underlying move in the US dollar gold price was slightly better than the table figure suggests. Expectations that interest rates will stay higher for longer continue to work against gold, because it pays no income, while renewed conflict in the Middle East and continued buying by central banks provided support. Over the past year gold has still returned 22.54%.
Disclaimer
The information provided in this communication has been issued by Centrepoint Alliance Ltd and Ventura Investment Management Limited (AFSL 253045).
The information provided is general advice only has not taken into account your financial circumstances, needs or objectives. This publication should be viewed as an additional resource, not as your sole source of information. Where you are considering the acquisition, or possible acquisition, of a particular financial product, you should obtain a Product Disclosure for the relevant product before you make any decision to invest. Past performance does not necessarily indicate a financial product’s future performance. It is imperative that you seek advice from a registered professional financial adviser before making any investment decisions.
Whilst all care has been taken in the preparation of this material, no warranty is given in respect of the information provided and accordingly neither Centrepoint Alliance Ltd nor its related entities, guarantee the data or content contained herein to be accurate, complete or timely nor will they have any liability for its use or distribution.